1) TDE file limitaion is
Monday, 2 May 2016

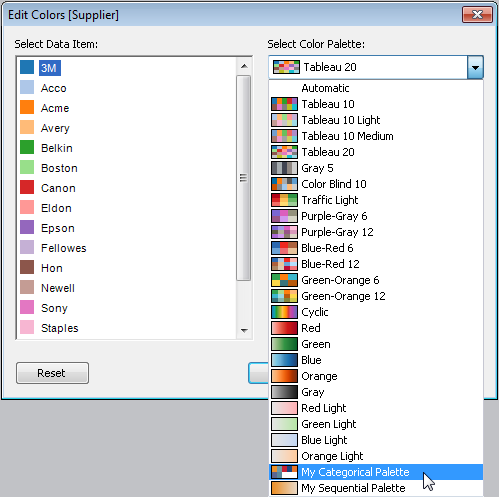
How to add Custom Color to Tableau?
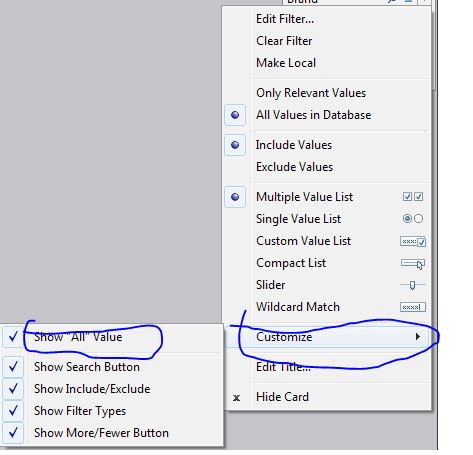
How to remove All options from a Tableau auto-filter?
How many maximum tables can you join in Tableau?
The limitations while connecting from Tableau to Database is : The maximum number of 32 tables can be joined in Tableau. A table size must also be limited to 255 columns (fields).
How to do Performance Testing in Tableau?
Performance testing is again an important part of implementing tableau. This can be done by loading Testing Tableau Server with TabJolt, which is a “Point and Run” load generator created to perform QA. While TabJolt is not supported by tableau directly, it has to be installed using other open source products.
Difference between Aggregate & Non-Aggregate Measures
AGGREGATED MEASURES
Aggregate measures means implementing one of the Arithmetic Calculations.
It means After the calculations.
EX: Sum((Sales])
If you want to filter the data where Sales volume is more than 2000000 after the calculation then we can use the following approach.
If Sum([Sales]) >= 2000000 then "Show" end

NON-AGGREGATED MEASURES
NON-AGGREGATED MEASURES means without using the any kind of Arithmetic Calculations.
EX: (Sales])

What is Data Visualization?
Data Visualization is the process of using the Methods & Technologies to interpret & representing the data in right way.
Target Audience of Data Visualization are : Middle & Top Level Management. These VIZ are used to Understand the BUZ, Make the Decision accordingly and it is sued to know the trends of the BUZ, Analyze the BUZ, Compare with competitors to know where are standing in the market.
Representing the Data means Show the data in meaningful way, Once we build the Views those sould be understandable to the end users without our interpretation.
Subscribe to:
Posts (Atom)